Case study · SAIP · Ontology platform · S2W · 2025.08 ~ Present · My time on it
Business analytics time cut by 95%+
I build SAIP's frontend, then use the platform to solve customers' problems on site. I'm one of three people planning the product.
The problem on site
Every month, the customer's analysts gathered performance figures and, when a number looked off, asked the team behind it for the cause before writing the report. But it was hard for them to judge whether the explanations held up.
Who did what
| My part | On-site requirements gathering | Done solo | 2 companies · Met customers in person · Tracked down the data and its owners · Set up follow-ups myself |
|---|---|---|---|
| Ontology schema design | Done solo | ~40 entity types · ~70 relations | |
| Customer data analysis | Done solo | Designed how the data joins · Reviewed potential insights with AI agents · Data analyzed: 500+ stores | |
| SAIP's 26 frontend screens | Done solo | Built solo over 8 months · Primary frontend engineer on SAIPAs of 2026.08 | |
| With others | Product planning | Led | 1 of 3 · Led feature proposals and product specs |
| On-site adoption | Led | Customer feedback loop: iterated until the goal was metIn real use since 2026.07 | |
| Led by colleagues | The servers and AI agents | ||
| Another team | Closed-network installation | My part ends when I hand off the frontend build | |
| Product | On-premises operation | Runs inside customers' closed networks | |
| SAIP adoption | 2 companies · 13 teamsProduct-level · as of 2026.09 |
Product context
Product · what SAIP does
SAIP walks a team from defining a Goal through pipeline and ontology design, search indexing, and human-in-the-loop approval workflows to natural-language Chat and a governance Dashboard.
The question SAIP takes on: how do you make it easy to build the data behind a knowledge-graph-driven decision?
SAIP ingests up to 65 GB per batch from relational databases, CSVs, and PDFs. Product capability · as of 2026.07
S2W describes SAIP as an “ontology-based decision OS.” S2W's product page (s2w.inc)
Listening on site
I went on site to gather requirements firsthand. I met customers at 2 companies in person, tracked down where the data lived and who owned it, and set up the follow-up meetings myself.
The hardest part wasn't the technology. It was the data: each party that processed it used a different structure, and the conventions weren't written down anywhere, so a large part of the work was decoding and pinning them down one by one, in constant conversation with the customer's hands-on and operations staff.
The pattern first, instead of reading every report
- Situation
- 100 PowerPoint and Excel reports from three years
- Decision
- Read 8~10 of them to find the pattern instead of all 100
- Check
- Confirmed with the customer's staff that the rest followed the same pattern
- Result
- Standardized extraction through prompt engineering
A 10-by-10 grid standing for 100 reports. Only the 8 to 10 I read myself are marked in orange.
Structuring the data
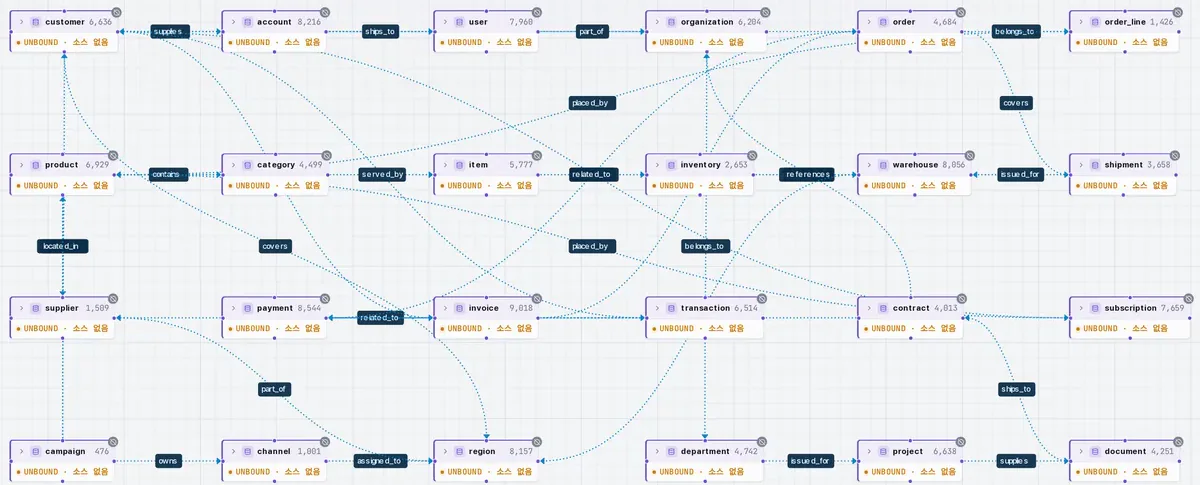
Seven axes for inconsistent reports
- Problem
- Inconsistent performance reports
- Design
- An ontology that normalizes them onto seven axes (the axis names are left out)
- Design
- How the source data joins
- Result
- 700,000~1.25 million source rows a month → about 200 records a month that actually matter for business decisions
I used AI agents to review the insights the customer data could yield.
700,000 to 1.25 million source rows a month pass through an ontology that normalizes the reports onto seven axes and become about 200 records a month that actually matter for business decisions. I designed these data joins.
Verification
Product · what SAIP does
My part
Building the screens
As SAIP's primary frontend engineer, I built its 26 frontend screens solo over 8 months. As of 2026.08
After I joined, SAIP had no designer, so I did the UI design myself, with AI assistance.
Screens I built
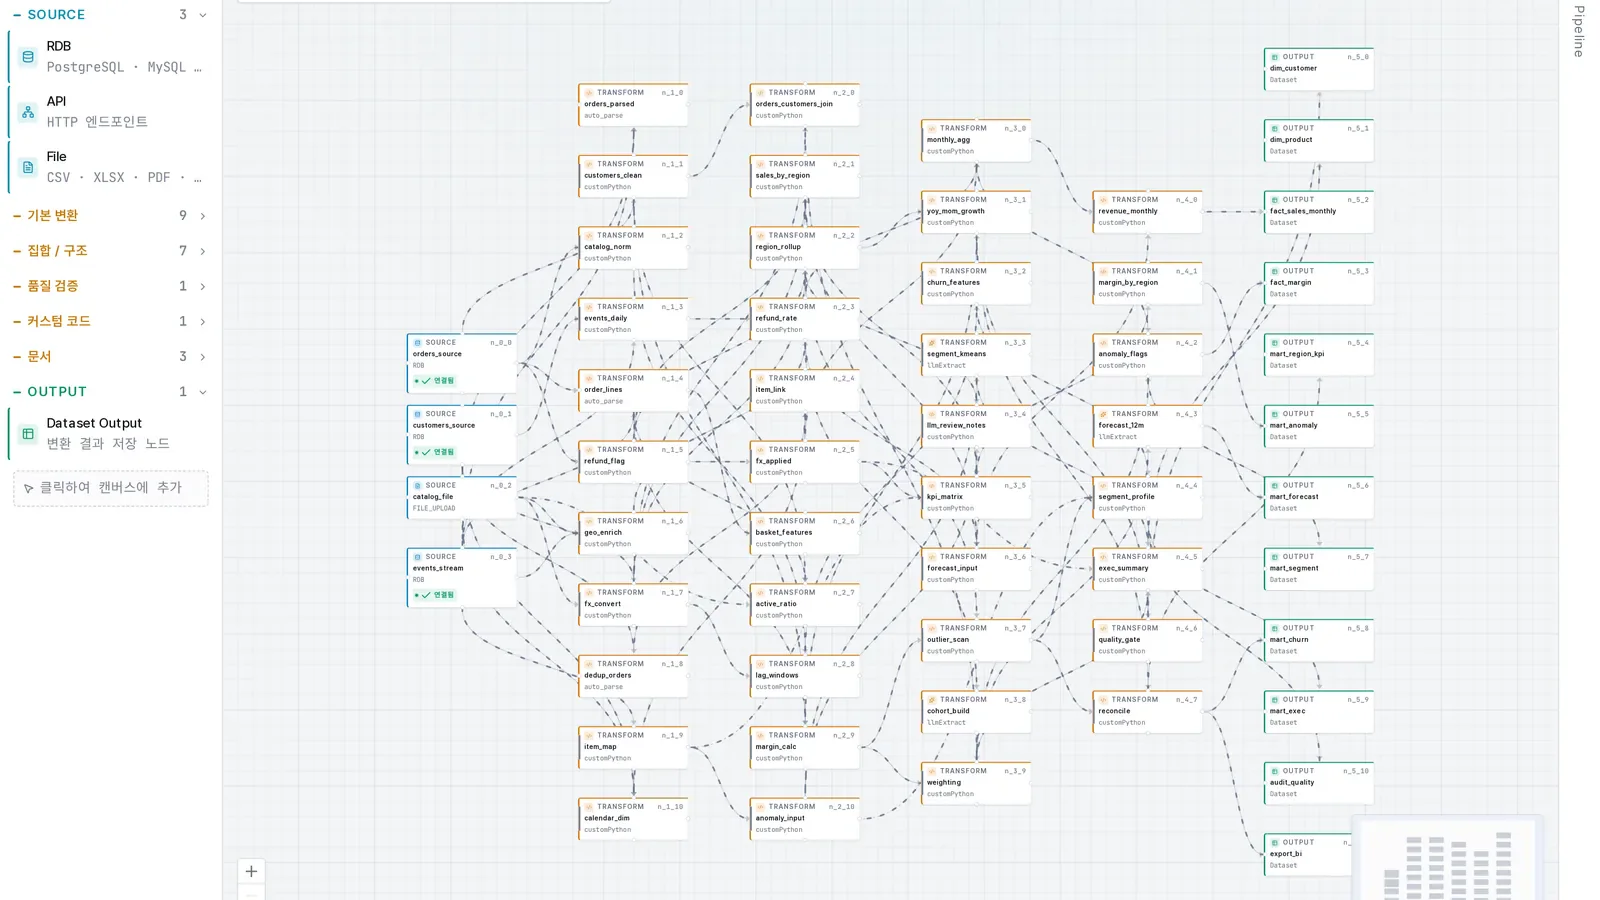
- Pipeline editor (including the LLM Extract node)
- Ontology graph
- Overview
- Agent Panel
- Workflow condition UI
- Business analytics dashboard
I built the UI for the Agent Panel, the AI assistant inside the editors: it drafts proposals from natural-language requests, and the user reviews each one, then approves or rejects it.
The hardest part was the pipeline editor.
Pipeline editor: when to compute
- Option A
- Compute everything continuously: slow
- Option B
- Compute nothing: the user only finds a break after running the whole pipeline
- Decision
- Compute data only when the user asks for it; check schemas in real time
- Result
- The moment an upstream change breaks a downstream node, that node says so
95%+
Cut in business analytics time
The output is a reporting-ready dashboard plus a question-and-answer chat.
In real use since 2026.07
I used SAIP directly in the customer's business analytics workflow and iterated on their feedback until the goal was met. Led
Product · what SAIP does
Movements past the threshold that seasonality explains are filtered out; the ones it doesn't explain are shown with the related events and evidence. To find a cause, SAIP follows about 50 connected ontology nodes to similar cases from the past three years and shows them alongside this month's actual figures and market trends built from public data.
SAIP's product principle: every conclusion has to be traceable back to the source data.
Together with another team at the customer, I built use cases for unstructured-document summarization and pipeline processing.
Taking it to planning
I took what came up on site into product planning, and the product changed.
On site I saw that most of the transform nodes we had carefully built went unused, so I proposed what to take out, not just what to add.
| What changed in the product | Who |
|---|---|
| Unused transform nodes were removed, so processing converged on SQL Query and custom Python nodes | Me: proposed what to take outProduct: made the change |
| The verification pipeline became a product feature | Product |
| Single-line workflows gained branching | Me: the condition UIProduct: execution |
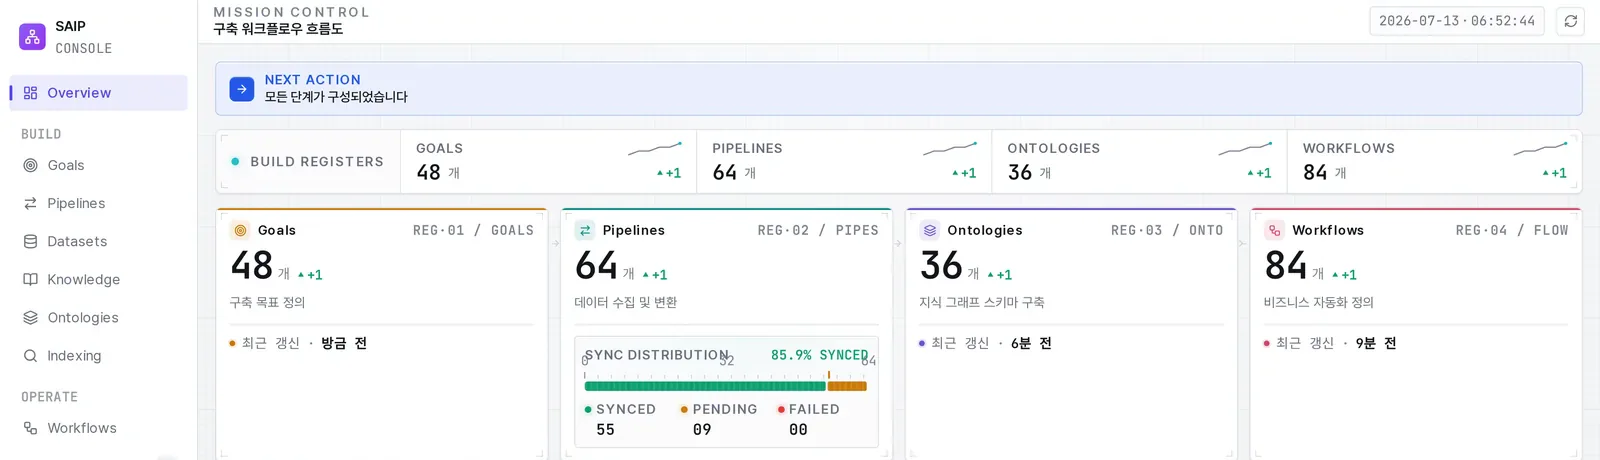
| The product gained an Overview screen that shows all the data in the platform at a glance | Me: built the new screen |
| AI Chat gained richer data visualization, and the ontology's English-only relation (edge) definitions gained Korean labels | Product |
Not done yet
I haven't yet done a closed-network install or set up servers and infrastructure. Today my part ends when I hand off the frontend build; closed-network installation is the next step.
Happy to chat.
About this case study
- Key numbers are labeled with their scope and date.
- Customer names and customer data are left out.
- Every SAIP screenshot here shows a screen I built: product UI with demo data.
- What I did is written in the first person; what the product does is written in the third person.
As of
Online: taeho.world/en/work/saip/